Sheldon.studio srl
Via dei Portici, 70
39100 - Bozen-Bolzano, IT
PI 03061940213
What to do when your customer asks you 'We would like to create a dataroom with all the data on the planet, can you?' 😅 Good question! How to relate data on climate, with data on population, water, nutrition or biodiversity? It's quite a mess. It is methodologically incorrect to relate data that belong to different worlds and methodologies... but at the same time they talk about the same thing, our planet, and we know that it is all connected!
So, we imagined a system to return the complexity and the large amount of data. Yes, because we are talking about data from more than 200 states, spanning up to 90 years! This is how the concept of an information widget came into being, a small unit that can take on different forms. Histogram, line, simple number. A super-flexible information system that returns the capillarity of data.
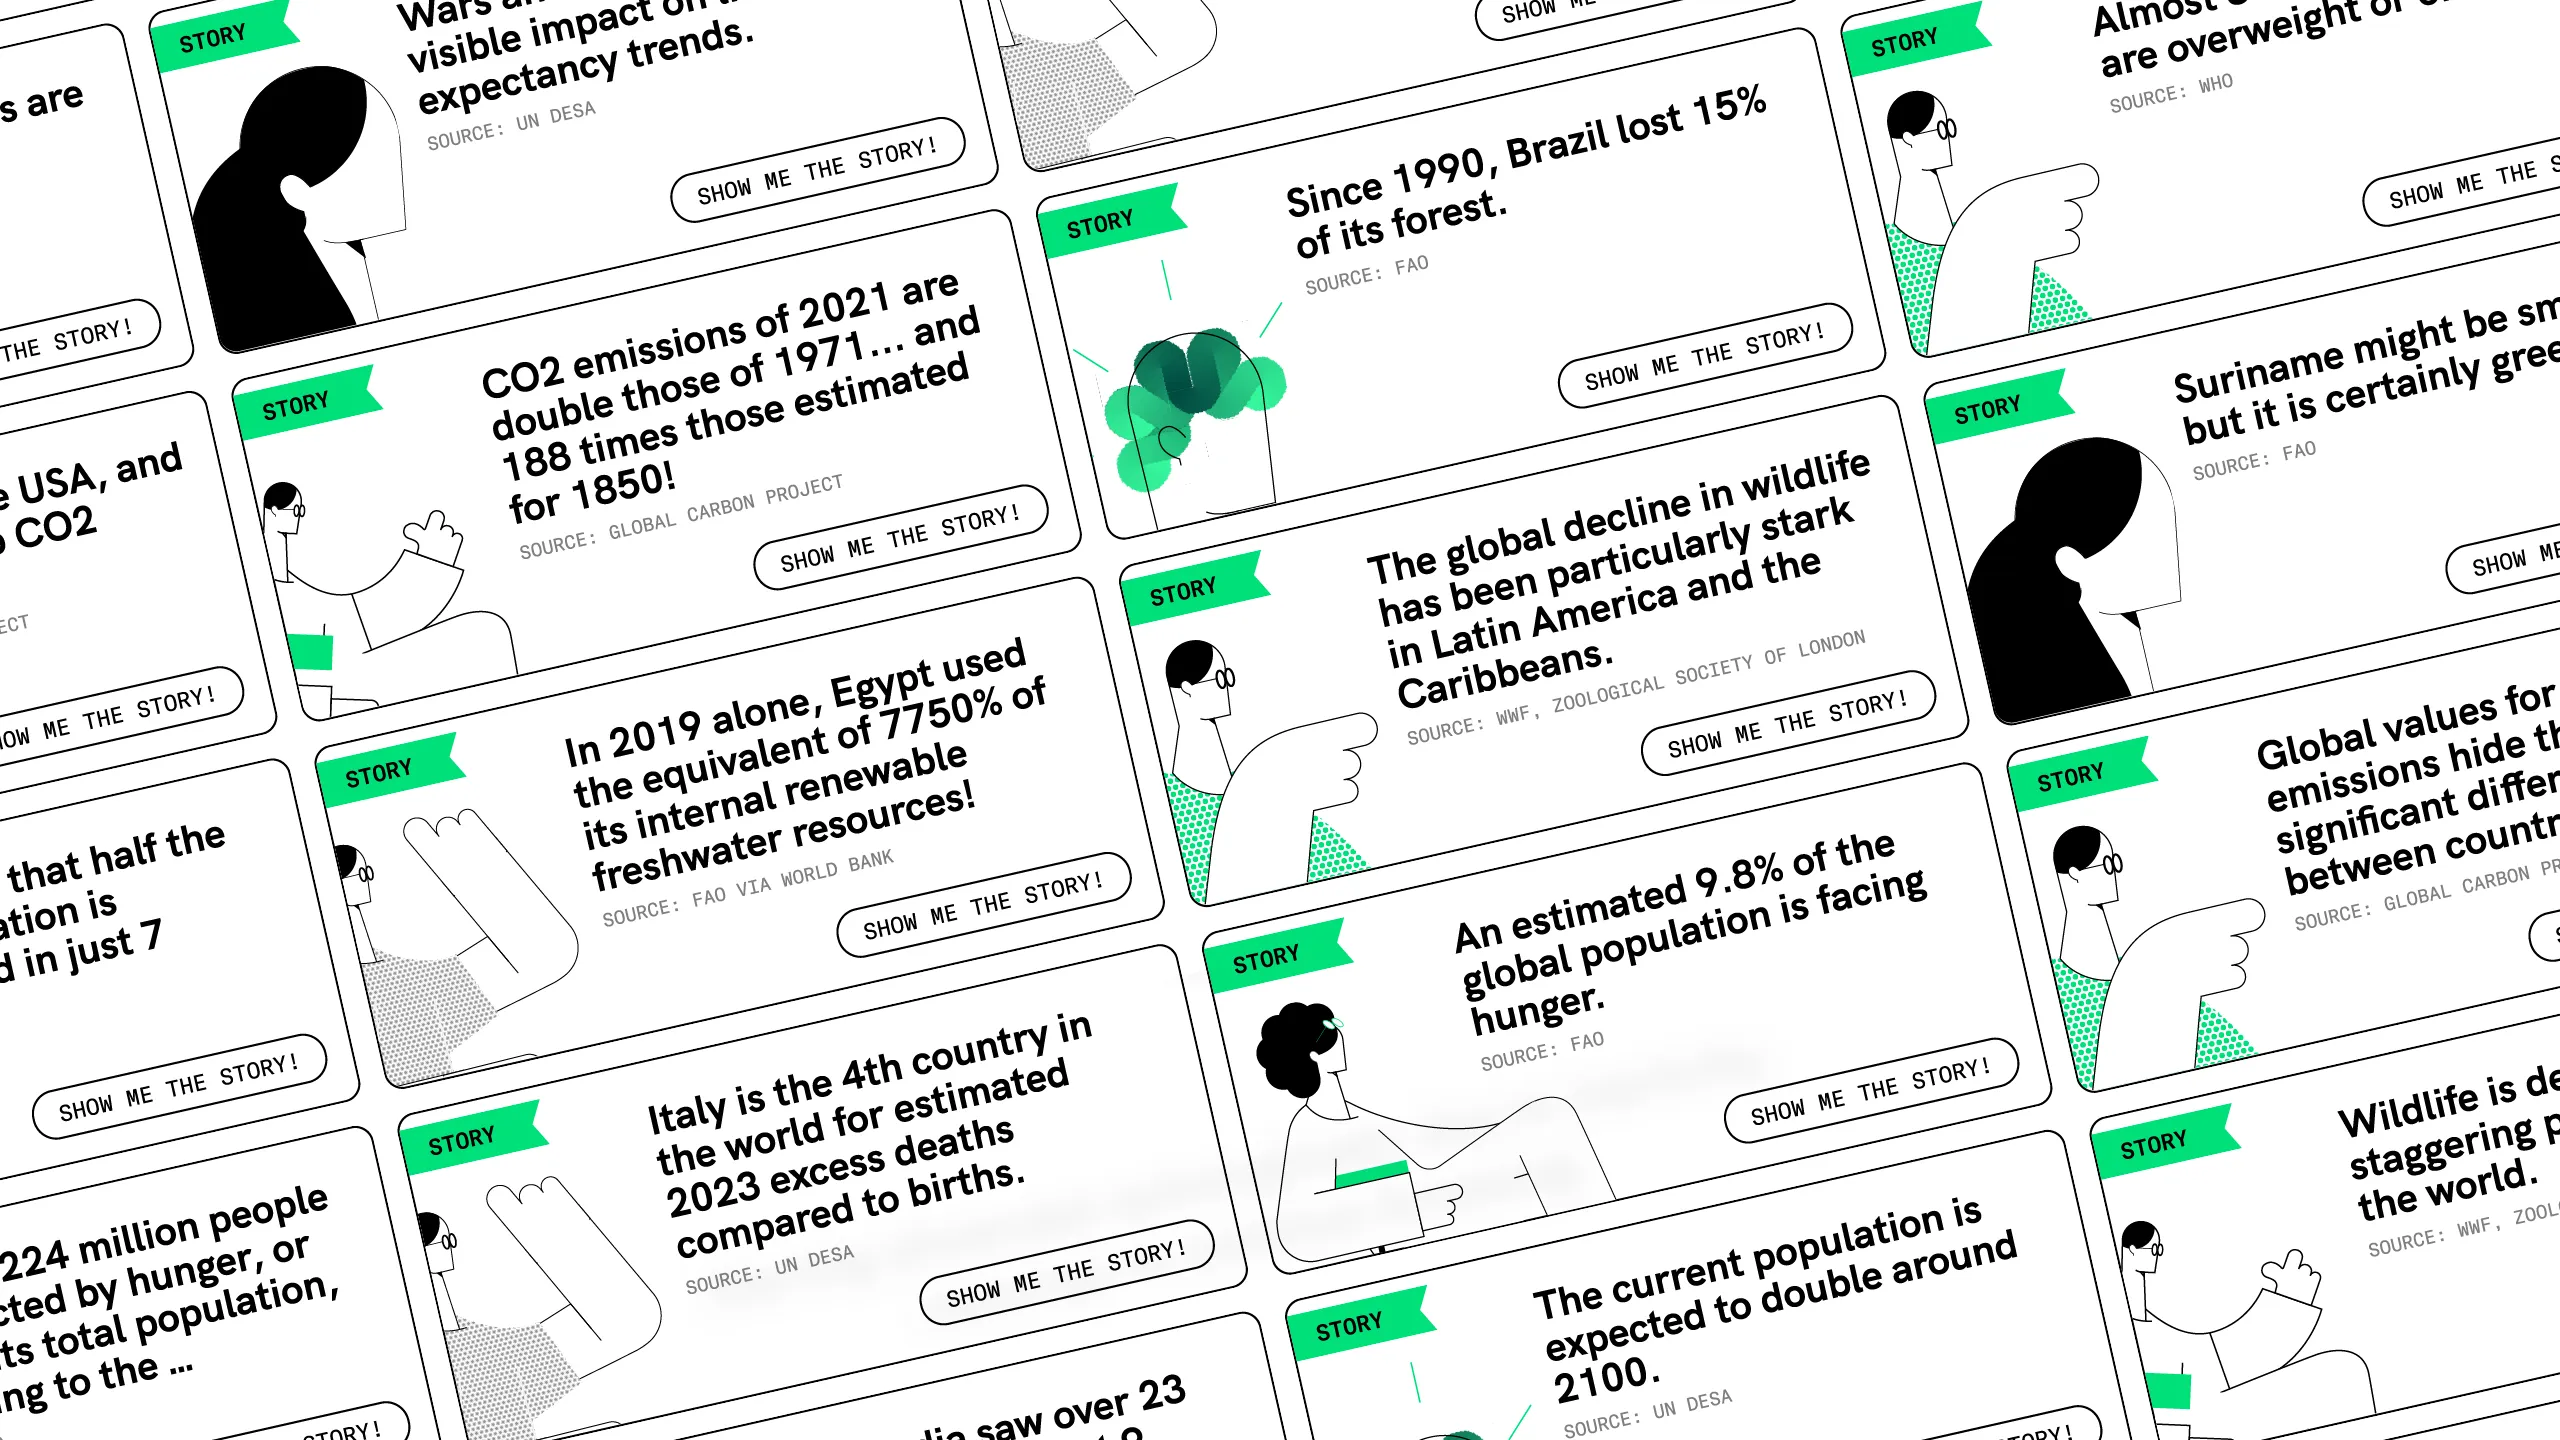
To save visitors from data suffocation, we also imagined an assisted exploration. Called 'Stories', each offers an entry point on a specific topic, supported only by the respective data. There are more than 30 stories aggregating different data sets.
The seed dataroom is a common good available to anyone, from journalists to creators, or citizens. It is a tool to discover the complexity in which we are immersed and connected.
Follow us on
Instagram
LinkedIn
Spotify
Medium